A vehicle-hour is an additional hour a vehicle had to wait in traffic. It represents lost time from congestion. If the occupancy rate of vehicles was always known then it could be converted to person-hours or an hour a person was delayed.
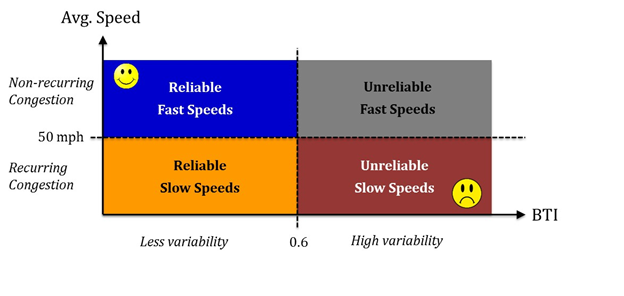
Congestion is identified as any 5 minute interval under 50 mph at each mainline station. The source is determined by looking at internal weather, incident, construction, and traffic speed databases. If indicators for multiple sources are present then a hierarchy of congestion sources is used as shown in the figure below.
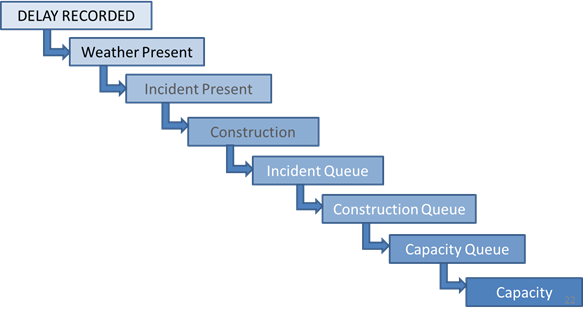
The result of using this approach means that topics near the top of the order exceed the actual amount in delay while those on the bottom are under. Incidents is only the source of congestion while the incident is active. So if an incident is cleared and a long queue still remains then this will be counted as capacity if no other factors are present. This can cause recording less delay than actual caused by incidents.